 AP Chemistry Tutoring
6.2 Energy diagrams
AP Chemistry Unit 6: Thermochemistry · 1 simulation · 7 practice questions
Updated · Aligned to the AP Chemistry Course and Exam Description
An energy diagram shows the relative potential energies of reactants and products for a chemical or physical process. If the products are lower in energy than the reactants, the difference is released and the process is exothermic, ; if the products are higher, energy is absorbed and the process is endothermic, .
Endothermic & exothermic
Exo: energy exits.
Like people moving out of California: the system loses energy, the surroundings gain it and get hotter. Products end lower than reactants: . Burning is the classic example.
Endo: energy enters.
Like money arriving in your bank account: it came from someone else. The system takes energy from the surroundings, which get colder. Products end higher: .
:
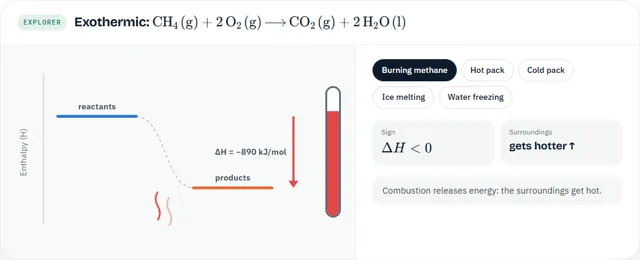
Breaking bonds always takes energy (endothermic). Forming bonds always releases it (exothermic). A reaction is exothermic overall when forming the new bonds releases more than breaking the old ones took.
Study notes
Key concepts
What an energy diagram shows (ENE-2.B.1). An energy diagram (also called a reaction-profile or potential-energy diagram) shows the energy of the system on the vertical axis and the progress of the reaction on the horizontal axis. It has three key features:
-
A horizontal line for the energy of the reactants on the left.
-
A horizontal line for the energy of the products on the right.
-
A hump between them. The top of the hump is the transition state (activated complex). The height from the reactant line to the top is the activation energy, Eₐ (from Unit 5).
Reading ΔH from the diagram. ΔH is the vertical distance from the reactant line to the product line, ΔH = H(products) − H(reactants).
| Diagram feature | Exothermic | Endothermic |
|---|---|---|
| Product line compared with reactant line | Lower | Higher |
| ΔH | Negative | Positive |
| Arrow for ΔH | Points down from reactants to products | Points up from reactants to products |
| Energy arrow between system and surroundings | Out of the system | Into the system |
Things that do and do not change ΔH.
-
A catalyst lowers the hump (Eₐ) but does not move the reactant or product lines, so ΔH is unchanged.
-
Reversing the reaction swaps the reactant and product lines: ΔH changes sign and the reverse activation energy equals Eₐ(forward) − ΔH(forward).
-
Doubling the amounts doubles ΔH, because enthalpy is an extensive property (it depends on the amount of substance).
-
Changing the physical state of a product changes ΔH. For example, a reaction that forms H₂O(l) has a product line lower than the same reaction forming H₂O(g), because condensing releases energy.
Diagrams for physical changes. The same idea works for physical processes. For melting ice, the "reactant" line H₂O(s) is lower and the "product" line H₂O(l) is higher by 6.01 kJ/mol; there is no large hump to draw for a simple phase change. For multi-step reactions, each step has its own hump; the overall ΔH is still the difference between the first reactants and the final products.
How to describe a diagram in words on an exam. Label the axes ("Potential energy" and "Reaction progress"), label the reactant and product lines with formulas, draw a vertical arrow for ΔH and another from reactants to the top of the hump for Eₐ, and make the relative heights match the sign of ΔH.
Worked examples
Example. For N₂(g) + 3 H₂(g) → 2 NH₃(g), ΔH° = −92 kJ/molᵣₓₙ and Eₐ = 230 kJ/molᵣₓₙ (uncatalyzed). Describe the energy diagram and find Eₐ for the reverse reaction.
Solution. The reactant line (N₂ + 3 H₂) is drawn on the left. The product line (2 NH₃) is drawn on the right, 92 kJ lower. The hump rises 230 kJ above the reactant line. A downward arrow of 92 kJ from the reactant level to the product level is labelled ΔH = −92 kJ/molᵣₓₙ. For the reverse reaction, the climb from the product line to the top of the hump is 230 + 92 = 322 kJ/molᵣₓₙ. A catalyst would lower both activation energies by the same amount but leave ΔH at −92 kJ/molᵣₓₙ.
Unit 6 study guide: exam-style free-response set, worksheet and answers.
Worked example
- .
- Negative : energy is released.
- Answer: ; exothermic.
Free-response practice
Write your answer first, then open the solution and mark yourself against it.
FRQ 6.2-1. The decomposition of calcium carbonate is CaCO₃(s) → CaO(s) + CO₂(g), ΔH° = +178 kJ/molᵣₓₙ.
(a) Describe an energy diagram for this reaction. State which line is higher and which way the ΔH arrow points.
(b) Is energy transferred into or out of the system? Explain how a student could detect this.
(c) What is ΔH for the reverse reaction, CaO(s) + CO₂(g) → CaCO₃(s)? Explain using the diagram.
Show the solution
(a) Axes: potential energy (vertical) and reaction progress (horizontal). The reactant line, CaCO₃(s), is on the left. The product line, CaO(s) + CO₂(g), is on the right and 178 kJ higher. A hump sits between them, above the product line. The ΔH arrow points up from the reactant line to the product line and is labelled +178 kJ/molᵣₓₙ.
(b) Into the system (endothermic). The reaction only continues while the solid is strongly heated; if heating stops, the decomposition stops. If the reaction were run in a container surrounded by water, the water temperature would fall.
(c) −178 kJ/molᵣₓₙ. Reversing the reaction makes CaO + CO₂ the starting line and CaCO₃ the end line. The vertical distance is the same, but now it is downward, so ΔH has the same size and the opposite sign.
FRQ 6.2-2. A two-step reaction has these data (per mole of reaction): reactants 50 kJ, first hump 140 kJ, intermediate 90 kJ, second hump 120 kJ, products 10 kJ.
(a) Calculate the overall ΔH.
(b) Which step has the larger activation energy? Give both values.
(c) Is the first step endothermic or exothermic?
Show the solution
(a) ΔH = 10 − 50 = −40 kJ/molᵣₓₙ (exothermic overall).
(b) Step 1: Eₐ = 140 − 50 = 90 kJ. Step 2: Eₐ = 120 − 90 = 30 kJ. Step 1 has the larger activation energy (it is the slow step).
(c) Endothermic: the intermediate (90 kJ) is higher than the reactants (50 kJ), so step 1 has ΔH = +40 kJ.
Common mistake
Students read as the height of the peak. The peak relates to activation energy; is only the difference between the product and reactant levels.
Frequently asked questions
?How do you tell if a reaction is exothermic from a graph?
If the products end lower than the reactants, energy was released and the reaction is exothermic.
?Does a catalyst change the energy diagram?
It lowers the activation-energy peak but leaves the reactant and product levels, and therefore , unchanged.
Practice questions on 6.2
- Q1On an energy diagram the products are lower in energy than the reactants. The reaction is
- Q2For the reaction X + Y₂Z → 2 Y + XZ, an energy diagram shows the reactants at 20 kJ and the products at 70 kJ (per mole of reaction as written). How much energy is absorbed when 3 mol of Y is formed?
- Q3An energy diagram for a reaction shows the reactant line at 120 kJ, the top of the hump at 200 kJ and the product line at 40 kJ. Which values are correct for the forward reaction?
- Q4A catalyst is added to a reaction. Which change appears on its energy diagram?
- Q5Which description matches an energy diagram for the process H₂O(l) → H₂O(g)?
- Q6The reaction absorbs 60 kJ as written. How much energy is absorbed when 1.5 mol of D forms?
- Q7A multistep energy profile ends with the products 40 kJ below the reactants. What is the overall reaction?
Terms used in this topic
Stuck on a unit? Let us fix it this week.
Book a 30-minute one-to-one session for $20. Bring a test, a homework set or the topic that is not clicking.
Book a session